![]()
![]()
![]()

Inquiries
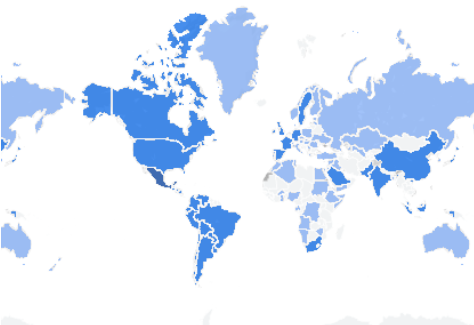
Geographical distribution of inquiries to the journal in 2026, according to Google Analytics (as of June 15, 2026).
Citation
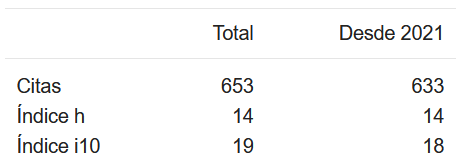
Google Scholar table with an analysis of academic citations.
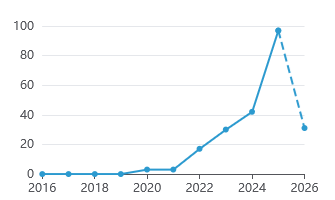
Graph of citations by year of publication provided by Scilit.
Authorships
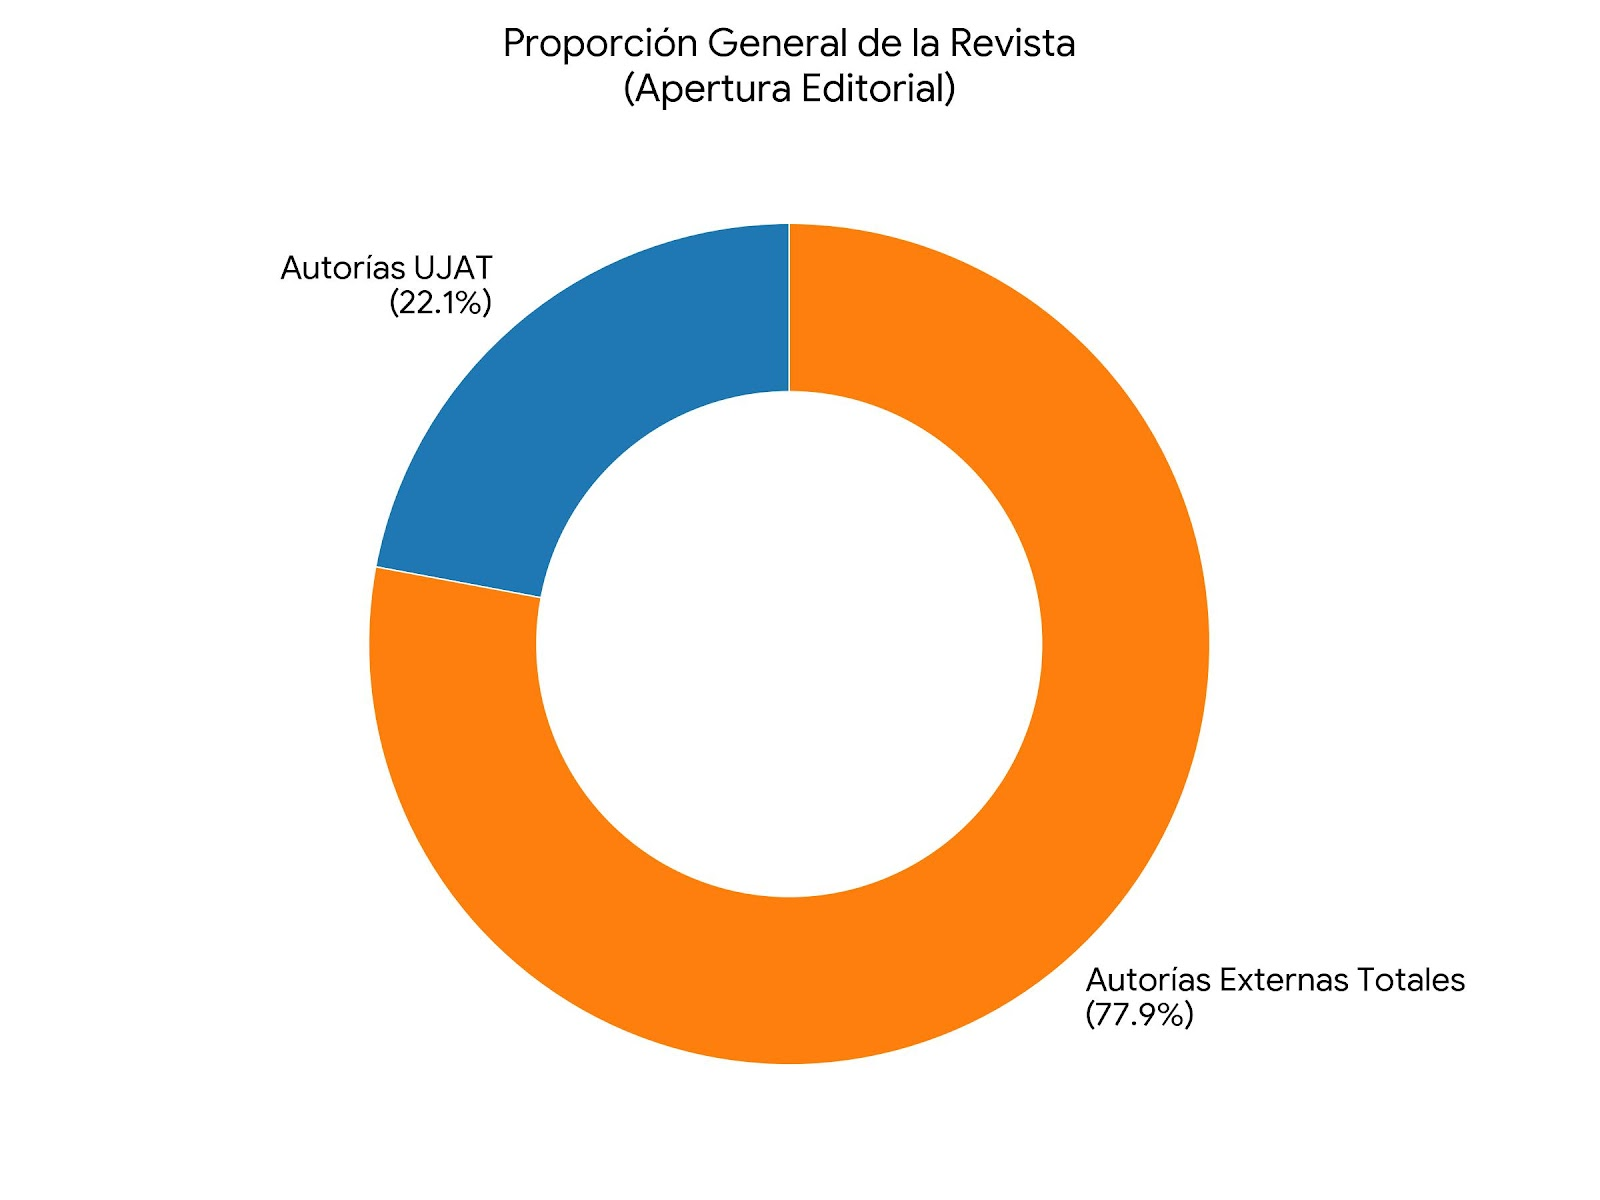
Graph created using our own statistics to represent the institutional endogamy index (as of June 15, 2026).
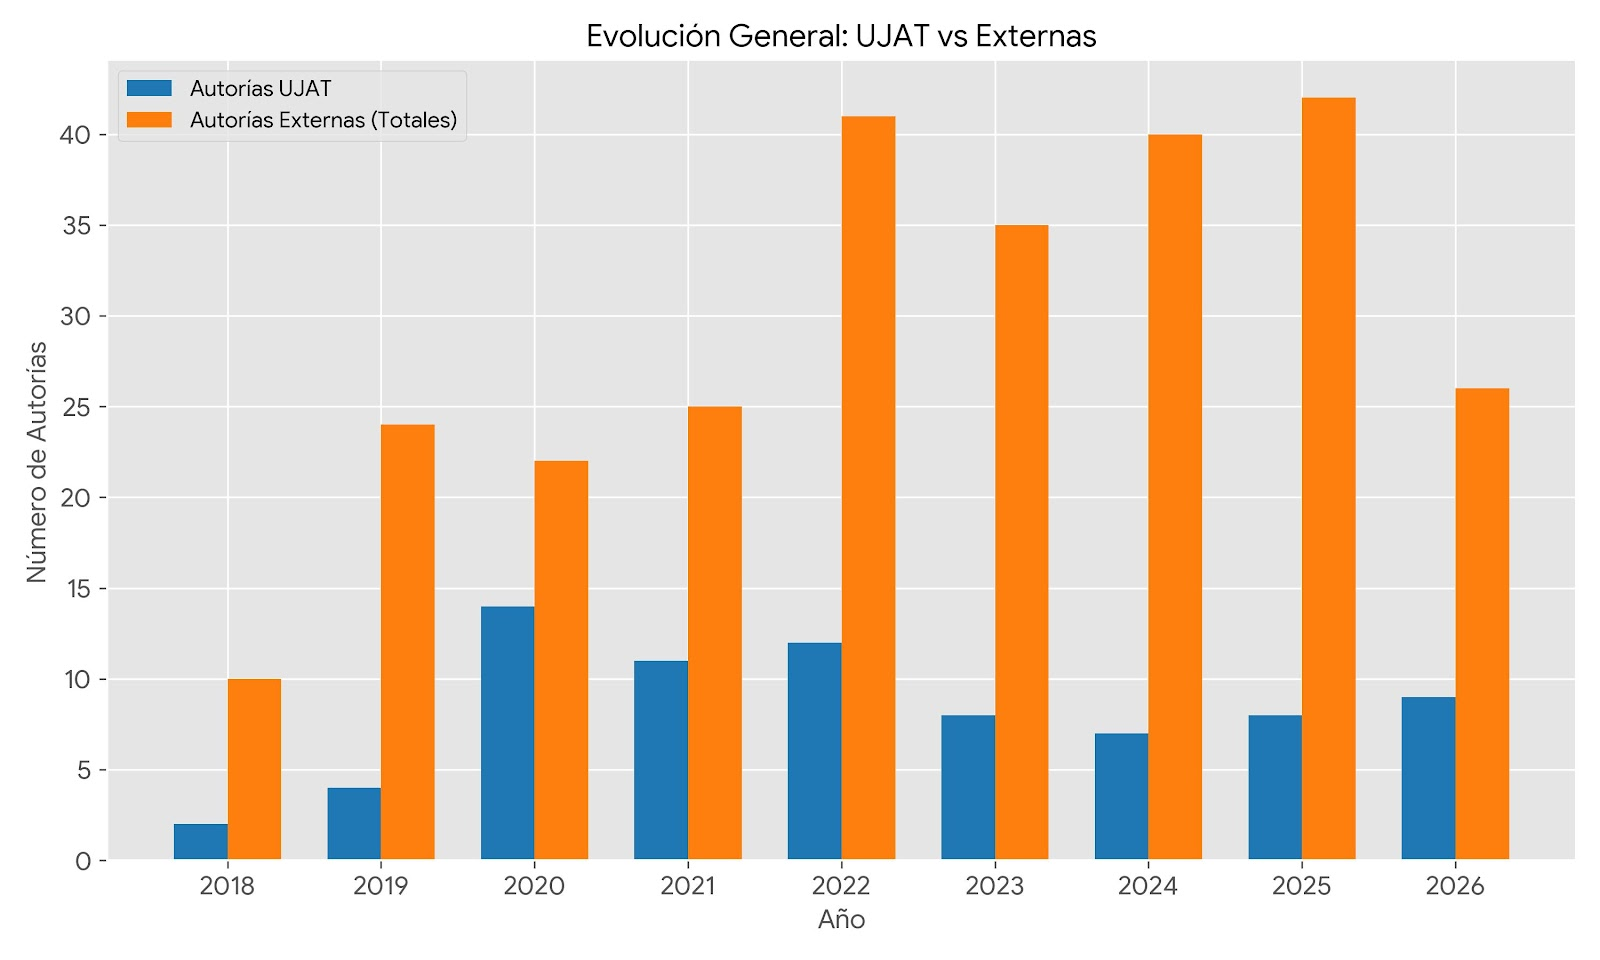
Graph created using our own statistics (as of June 15, 2026).
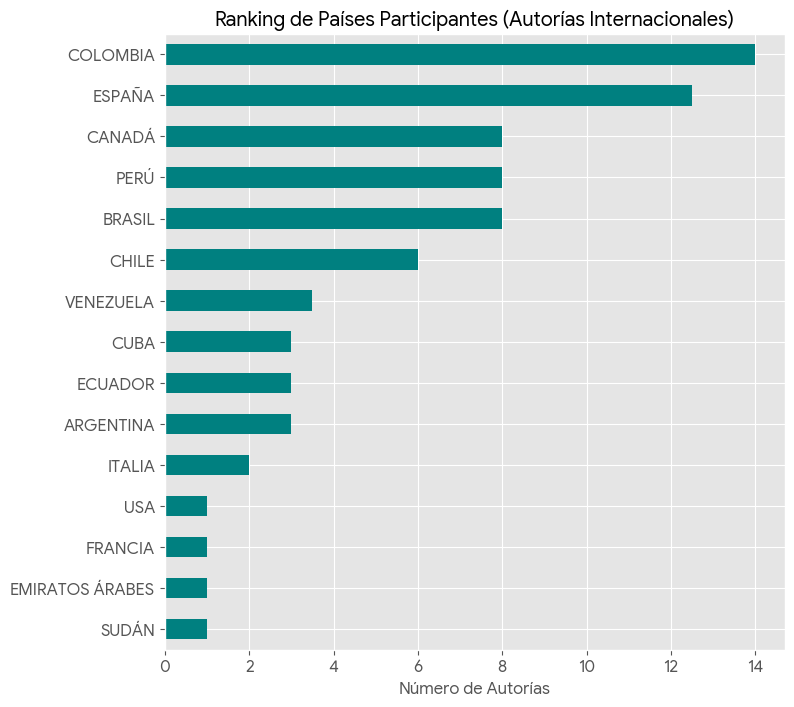
Graph created using our own statistics to represent international collaborations (as of June 15, 2026).
![]()
![]()
![]()
e ISSN: 2594-2840
DOI prefix: 10.19136/etie


Renovación: Marzo 11, 2021
EMERGING TRENDS IN EDUCATION, year 8, number 16, January-June 2025, is a biannual publication edited by the Universidad Juárez Autónoma de Tabasco, Av. 27 de Febrero #626, Col. Centro, Villahermosa, Tabasco, México. C.P. 86000, Tel. (+52) (933) 358 15 00, Ext. 6309, 6313. URL: https://revistaemerging.ujat.mx, email: emerging@ujat.mx. Editor in chief: Dr. Deneb Eli Magaña Medina, email: editoremerging@ujat.mx. Reservation of rights to the exclusive use 04-2018-071810385400-203, ISSN: 2594-2840, both granted by the Instituto Nacional del Derecho de Autor. Responsible for the last update of this issue, Dr. Arnulfo López Ramos. Date of last update: June 16, 2026.
The opinions expressed by the authors do not necessarily reflect the position of the editors of this publication or of the Universidad Juárez Autónoma de Tabasco. Emerging Trends in Education adheres to the ethical principles of the Committee on Publication Ethics (COPE).
Articles published in Emerging Trends in Education are subject to a Creative Commons CC BY-NC-ND 4.0 license and may be reproduced for any non-commercial use with attribution to the author. Derivative works are not permitted.
![]()
Our academic social networks are at your disposal:

Contact for information and comments:
![]()
